It's December 11 and several of my listings have been out of stock for 1 or 2 weeks.
This is my fifth Q4 and I am still underestimating sales volume and running out of stock!
Being out of stock at the beginning of December means missing 3 weeks of extremely high sales. I'll use one of my listings as an example to explain.
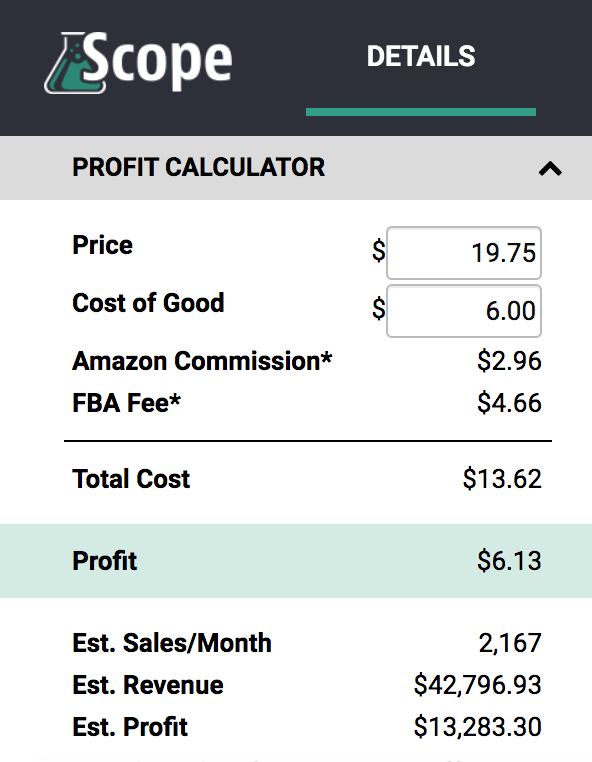
The image below is the Scope sales estimate for 1 of my listings:
As you can see, the estimated sales volume is 2,167 units. This is based on the current Best Sellers Rank (BSR)* of 1,216 in Health & Household.
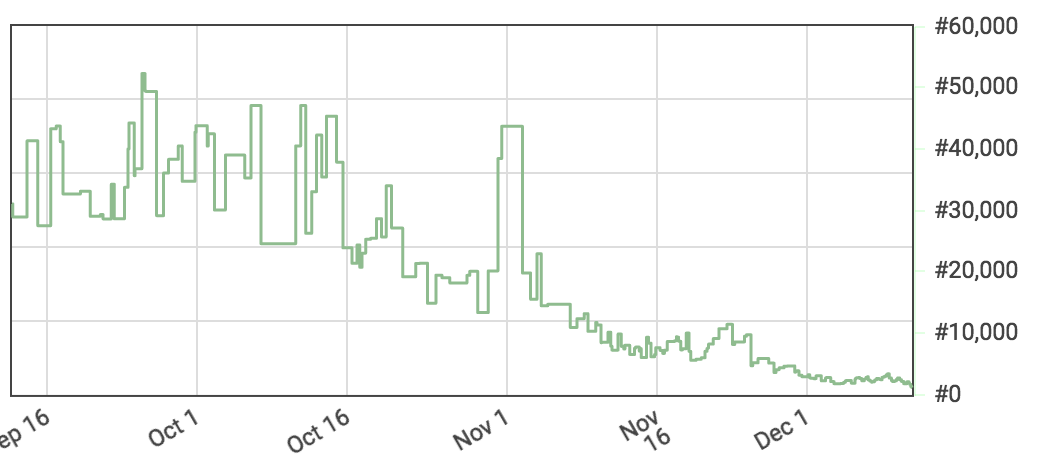
I always keep in mind that BSR and any sales estimates are based on a snapshot in time. Therefore it is important to look at the historical BSR. I do this using the free Keepa Chrome extension which displays a graph on each Amazon product page as shown below.
I always keep in mind that BSR and any sales estimates are based on a snapshot in time. Therefore it is important to look at the historical BSR. I do this using the free Keepa Chrome extension which displays a graph on each Amazon product page as shown below.
 Amazon Best Seller Rank (3 Months)
 As can be seen from the 3 month Keepa chart above, the BSR starts to improve around the 2nd week of November (the spike around Nov 1 is due to being out of stock).
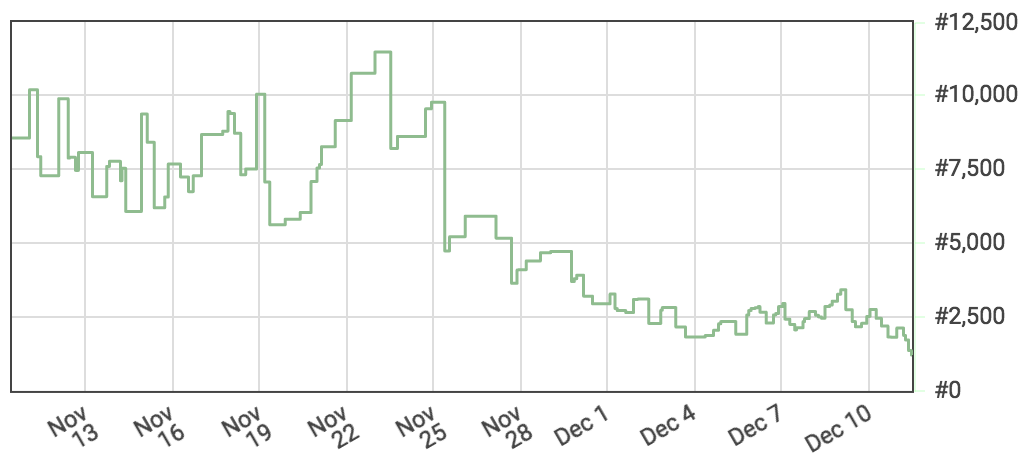
The 1 month Keepa chart below show the average BSR in November is approximately 7,500 and in December it is 2,500. At the time of writing this on Dec 11, the BSR is 1,216.
The 1 month Keepa chart below show the average BSR in November is approximately 7,500 and in December it is 2,500. At the time of writing this on Dec 11, the BSR is 1,216.
So how do I interpret and apply this data in terms of stocks?
1. Projecting Stock Quantities Needed
Firstly, I project estimated sales quantity for November and December using Jungle Scout's free estimator
Since this is just an estimated figure, I estimate that I should send in about 2,000 to 2,500 units to have enough stock for Nov and Dec.
2. Projecting Lead Time
Secondly I need to account for the lead time.
Lead time is calculated from the time I place my order with the supplier to the time it is available for sale on Amazon FBA. This includes:
Shipping and Amazon receiving times are things to especially note during the Q4 peak selling season. Both shipping companies and Amazon's fulfilment centers are often overwhelmed during this period, resulting in shipping and receiving delays. You might want to factor in 2-3 weeks of extra lead time for any shipments sent or received in Nov and Dec.
Example:
For this particular product my lead times are:
Total Lead Time = 5 to 6 weeks
Therefore in order to have stock available for sale by mid November, I should order from my supplier in the last week of September or early October.
Of course this is based on this particular product's sales and lead times. But you can easily use the same steps for your own products.
One final tip: Set reminders for yourself - I've added Reminders in Google Calender for Oct 2018 to reorder for next year.
1. Projecting Stock Quantities Needed
Firstly, I project estimated sales quantity for November and December using Jungle Scout's free estimator
- November Sales Estimate: 656 units (based on Nov's average BSR of 7,500 in Health & Household)
- December Sales Estimate: 1735 (based on Dec's average BSR of 2500 in Health & Household)
- Total: 656 +1735 = 2,391
Since this is just an estimated figure, I estimate that I should send in about 2,000 to 2,500 units to have enough stock for Nov and Dec.
2. Projecting Lead Time
Secondly I need to account for the lead time.
Lead time is calculated from the time I place my order with the supplier to the time it is available for sale on Amazon FBA. This includes:
- Production lead time
- Shipping
- Prep and labeling (if applicable)
- Amazon receiving time
Shipping and Amazon receiving times are things to especially note during the Q4 peak selling season. Both shipping companies and Amazon's fulfilment centers are often overwhelmed during this period, resulting in shipping and receiving delays. You might want to factor in 2-3 weeks of extra lead time for any shipments sent or received in Nov and Dec.
Example:
For this particular product my lead times are:
- Production time: 1 week
- Shipping time: 2 weeks (1 week from US supplier to US prep company + 1 week from prep company to Amazon Fulfilment Center)
- Prep time: 2 days
- Amazon receiving time: 3 weeks (usually 2-5 days, but I'm making allowance for Q4 delays)
Total Lead Time = 5 to 6 weeks
Therefore in order to have stock available for sale by mid November, I should order from my supplier in the last week of September or early October.
Of course this is based on this particular product's sales and lead times. But you can easily use the same steps for your own products.
One final tip: Set reminders for yourself - I've added Reminders in Google Calender for Oct 2018 to reorder for next year.
*What is Best Seller Rank (BSR), aka Sales Rank?
For those unfamiliar with BSR it's a number Amazon assigns to every listing that ranks it's best seller position within a category. Amazon groups listings into categories such as Baby, Home & Garden, Pet Supplies, etc. A products BSR is simply its best seller position in the category it is classified in. So for example. the best selling product in the Baby category would have a BSR of 1 in Baby, and the 100th best selling product's BSR would be 100. Therefore a lower BSR means higher sales.
It is also important to keep in mind, that BSR is continuously changing as various products sell. Amazon says they update BSR hourly, so it is important to realize that BSR can be volatile and to take it as an approximation. I typically buffer +/-50% to just get a rough estimate. The other thing I do is look at the historical BSR using Keepa to get a approximate average month to month.


 RSS Feed
